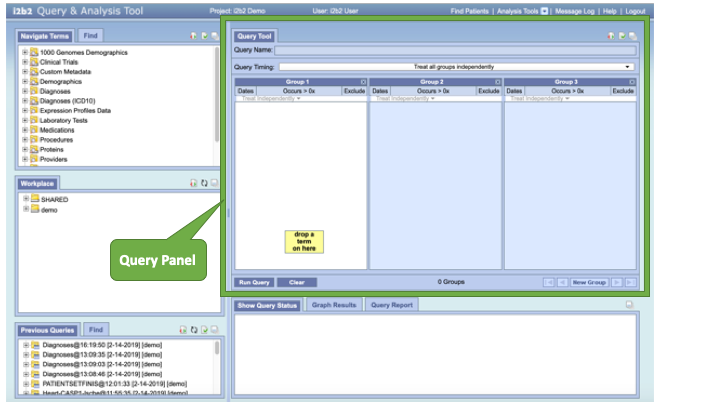
I2B2 QUERY Panel
The Query Panel is designed to simplify the process of retrieving information from the database associated to the i2b2 Web Client.
This section describes the layout and contents of the Query Panel.
For details on constructing and executing queries, see the section Searching in the Web Client
Layout of the Query Panel
The Query Panel is used to define and run a "select query" that will retrieve information from the database associated to the i2b2 Web Client. There are two main sections that include the actual query panel at the top and the Query Status section on the bottom. This lower portion (Query Status) is filled automatically with information on the status of the current query as well as results as they become available.
Components of the Query Panel include:

Query name
QT panel (3 groups)
Query timing toggle
New Group/Shift right/Shift left
Query Name (#5 in the figure)
The name of a query will be assigned when it is run and will display in the Query Name field. The only time a query name will appear prior to running the query is when you drag a previous query from either the Previous Query or Workplace views and drop it into the Query Name field.
QT Panels (#6 in the figure)
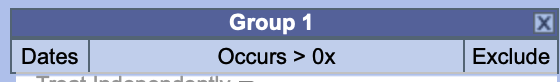
A panel is the section of the Query Tool view that contains information about a set of groups of concepts (Groups 1 to 3 are displayed by default; more can be added as needed). The panel can be broken down into the following sections for each Group.
Group Heading
The heading is a label to easily identify the collection of terms. Each heading will contain "Group" followed by a sequential number.
Example: Group 1, Group 2, Group 3, etc.
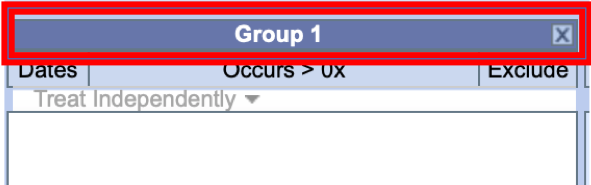
Selection Criteria
This area of the panel is used to define date selections and other constraints.
Query Panel Timing Toggle (#7 above)
The panel timing defines the constraint on the panel level and uses the patient's visits in determining eligibility.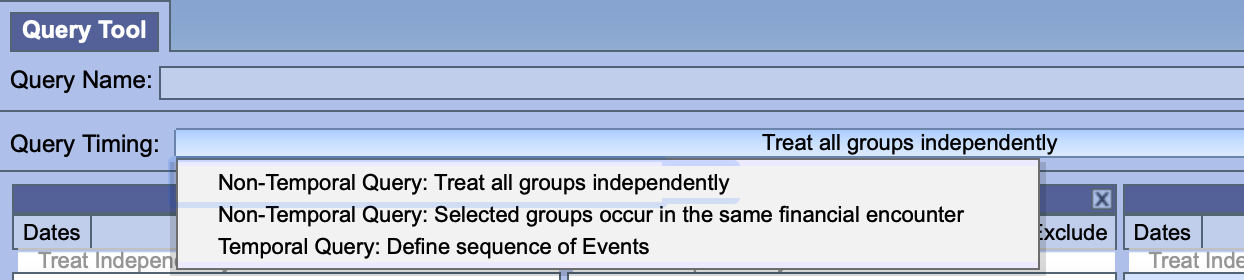
New Group - Shift Left/Right (#8 above)
This section contains the terms that will be used during the process of querying the database.

Information Box
The content in the information box will change depending on whether or not a term is listed in the panel / group.
- No term(s) listed
- The message will appear as "drop a term on here"
- The color of the box will be yellow
- Term(s) listed
- The message will appear as "one or more of these"
- The color of the box will be green
- An additional information box will appear between panels
- No term(s) listed
NOTE: Once you add an item to a panel, an additional information box will appear between the two panels containing the text "AND". This is to indicate that each panel will be joined with an AND operator when the SQL query is created. |
Toolbar
The toolbar is the bottom section of the Query Tool view and contains several buttons that perform various actions.
Run Query / Cancel Query Button
On the toolbar for the Query Tool there is a single button for running and canceling a query. Depending on the circumstances defined below the label on this button and its associated action will change to one of the following: (1) Run Query or (2) Cancel Query.
Run Query Button
Clicking on the button labeled Run Query will run your query with the defined search criteria.
Cancel Query Button
Once you start running a query, the label will change to Cancel Query. Clicking on the button when it says Cancel Query will cancel the query and free up the Query Tool / Web client so that you can continue to do other things.
NOTE: Clicking on Cancel Query in the Query Tool will only cancel the web client piece of the process. The server side will continue to run. |
Clear Button
The Clear button will reset the view to the default; this includes deleting the concepts listed in the panel and removing any constraint that have been defined.
Print Query Button
The Print button will open a window with the query information in a printable format.
Query Status View
The Query Status view is located below the Query Tool view and contains information regarding the status of a query that is either running or has just finished as well as the results of a previous query. While a query is running you will see the name of the query and how long it has been running. Once the query has finished, the number of patients meeting the search criteria will appear in this view. You will also see the length of time it took to retrieve the requested information. This is a display only view.
NOTE: The result types that appear will depend on what you have selected when running the query.. |
Options
Users can define how long to wait before a query will time out. This setting is defined in the Query Tool Options, which can be accessed by clicking on the Show Options button. The default setting is 180 seconds, which means the web client will wait for a response from the server for 180 seconds. Once it reaches that time it will display a message saying the query has timed out and will continue to run in the background.
To learn how to create or execute a query, click below to jump to
- Searching in the Web Client
- Creating a Query
- Executing a Query
- Complex Queries
- Temporal Queries