Translational Bioinformatics Warehouse Database Design.doc
The CTSA Ontology Mapper and Discovery Suite:
A Rules-Based Approach to Integrated Data Repository Deployment
Translational Data Warehousing Design
Strategies for Supporting the Ontology Mapper Project
Contents
3.1 Structured Database Design
3.2 Dimensional Database Design
3.3 Entity, Attribute, Value Architecture
3.4 Integrated Data Repository Design
4. Example Data Warehousing Design Approaches
The Ontology Mapper Project is intended to provide a mechanism for enhancing translational bioinformatics. This project takes a different approach to the standard data warehousing model and enhances it with the use of ontology mapping for biomedical terminology. In order to accommodate this novel approach, a review of current data warehousing design will be compared and contrasted.
|
Term |
Definition |
|
IDR |
Integrated Data Repository |
|
ETL |
Extract, Transform and Load |
|
HL7 |
Health Level 7 – Standard used for information transportation amongst disparate IT systems |
|
i2b2 |
Informatics for Integrating Biology and the Bedside |
|
ODS |
Operational Data Store |
|
CIF |
Corporate Information Factory |
|
Fact |
A business measure |
|
Dimension |
Textual descriptions of the business. Descriptions of facts |
Data warehousing is a method used to convert data into information. A clinical data warehouse can provide a structure for organizing data and render a positive impact for the purpose of patient care, biomedical research and biomedical education. However, developing a clinical data warehouse encompasses many difficult challenges. The data warehouse cannot be designed in one simple step.
The data warehouse architecture model shown in Figure 1 depicts the process of transforming operational data into information for the purpose of generating knowledge within an organization. The diagram displays data flowing from left to right in accordance with the corporate information factory (CIF) approach (Inmon et al, 2001). According to Inmon, the data enters the CIF as raw data collected by operational applications. The data is transformed through extract, transform and load processes and stored in either the data warehouse or the ODS, operational data store. “Often up to 80 percent of the work in building a data warehouse is devoted to the extraction, transformation, and load (ETL) process: locating the data; writing programs to extract, filter, and cleanse the data; transforming it into common encoding scheme; and loading it into the data warehouse.” (Hobbs, Hillson & Lawande, 2003, 6)
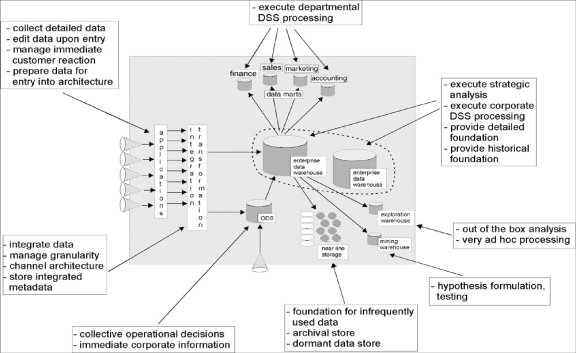
Figure 1 - Data Warehouse Architecture - (Inmon et al., 2001)
According to Kimball (2002), the data warehousing architecture can further been delineated into four categories:
- Source Systems
- Data Staging Area
- Data Presentation Area
- Data Access Tools
Source Systems may be composed of operational systems, legacy based systems or other data repositories. Data is transmitted or extracted from the source systems into the data staging area where it is processed. It should be noted that the staging area is not intended for direct query access. The purpose of data processing is to normalize the data, using standard data types, data lengths, precision of data and data naming conventions amongst the inbound extractions.
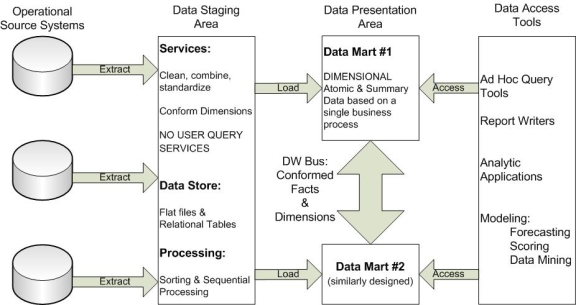
Figure 2 - Data Warehousing Components (Kimball, 2002)
Furthermore, after the data has been prepared, it is loaded into the de-normalized schema of the data warehouse or data marts and resides there in a fine grain level of detail. The logical design of a data warehouse is usually composed of the star schema. “A star schema is a simple database design (particularly suited to ad-hoc queries) in which dimensional data (describing how data are commonly aggregated) are separated from fact or event data ( describing individual business transactions).” (Hoffer, Prescott & McFadden, 2002, 421) The data mart design is intended to support the data presentation layer.
The final stage is in the process of converting data into information through reporting, analysis and data mining techniques. (Inmon et al, 2001) Kimball describes this stage as the data access tools area or in modern day vernacular, the business intelligence layer.
There are a variety of data modeling approaches for data warehousing design. These approaches can range from highly structured database design, dimensional database design, entity, attribute, value design, object oriented design to name a few.
3.1 Structured Database Design
Operational transaction processing systems are commonly created using a highly structured or normalized data model. This model is intended to reduce several anomalies (insert, update and delete) that may occur during data transaction processing. The goal of normalization theory, developed by E.F. Codd and CJ Date, is to determine where the functional dependencies exist within and amongst relations. It is supported by mathematical set theory, relational algebra and relational calculus. The end result is to produce a data model which reduces the opportunity for data redundancy, and provides the highest level of data consistency. Figure 3 is a depiction of a third normal form data model of patient visits and their associated observations.
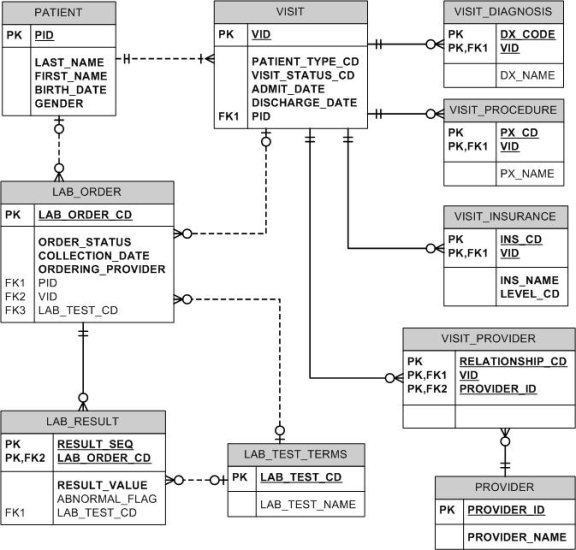
Figure 3 - Normalized Data Model Example
3.2 Dimensional Database Design
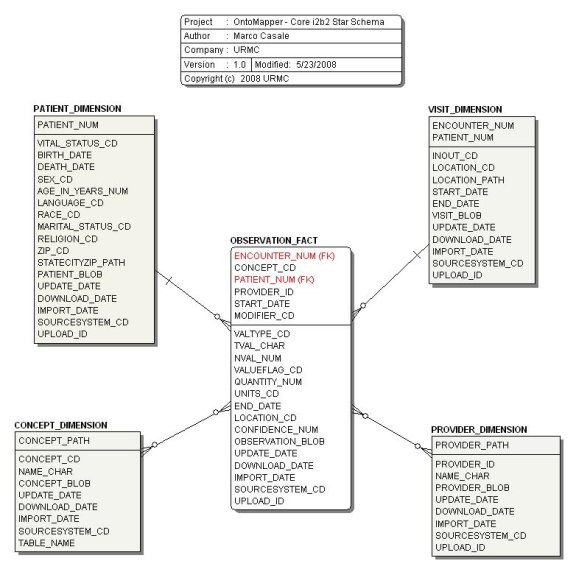
In contrast, Kimball proposed a dimensional modeling approach for data modeling design in support of high performance queries rather than high volume transaction processing. The dimensional model is composed of a fact table joined to several dimensions. A fact table is the primary table of the dimensional model. Each fact table contains measurable facts. “A row in a fact table corresponds to a measurement. A measurement is a row in a fact table. All the measurements in a fact table must be at the same grain.” (Kimball, 2002). Figure 4 is an example of a dimensional model that illustrates a fact table of ‘Daily Sales’ related to dimensions of Date, Product and Store.
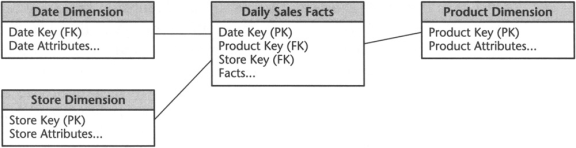
Figure 4 - Star Schema Example (Kimball, 2002)
“The dimension tables contain the textual descriptors of the business.” (Kimball, 2002). Each dimension table may be composed of many attributes. The dimension attributes are used to help qualify the criteria used in generating queries from the star schema. Every dimension table contains a primary key. Furthermore, the fact table contains a foreign key to every dimension table and typically, the primary key of the fact table is a composition of all of the foreign keys in the fact table, a composite primary key.
Now that the transformed data resides in the underlying fact and dimension tables of the data warehouse, the next step entails deriving the necessary aggregates that will define the associated data marts. “An aggregate is simply the rollup of an existing fact table along one of its dimensions, which more often than not is time.” (Scalzo, 2003, 147) For example, if a fact table holds daily automobile fatalities, then location-based aggregates might be town, county, and state. Thus, since the overall purpose of a data warehouse is to support the online analytical processing (OLAP) capabilities associated with data mining, the data in the warehouse must be propagated, as referred to in Figure 1, into information residing within data marts.
Data marts serve to hold specialized, codified, dimensional, aggregated data roll-ups in support of the OLAP tools that will be used to discover business relationships and organization insights. However, slicing a cube does not always yield the desired knowledge. As a result, there are times when exploratory data mining processes must be initiated against the data warehouse itself, as opposed to a specialized multidimensional array. This drill down technique can also be accomplished with OLAP tools, specialized data mining software or even customized ad-hoc programmatic queries running against the finer level of detail. The data access tools in Figure 2, processes all of these requests and coordinates the communication exchange between the warehouse or marts and the end user’s tools.
3.3 Entity, Attribute, Value Architecture
3.4 Integrated Data Repository Design
Inferenced Based Approach
Harvest Table Design
4.1 Partners Healthcare RPDR
A significant challenge for applications of clinical data warehousing has been the ability to make them facile for non-database experts. Typically, database experts are required to write complex query statements in order to extract data. The following example depicts how one organization dealt with this difficult dilemma.
Partners Healthcare Inc. created a research patient data repository (RPDR) in support of clinical research. Partners recognized the need for several database experts writing complex queries, when they started to receive 100-200 query requests per week. Partners decided to develop a graphical analytic tool to help novice database users create effective mining algorithms. (Murphy et al, 2003) Partners set out to develop a Querytool for the RPDR shown in Figure 5. However, they were confronted with many challenges.
Murphy described the first challenge as allowing novice population of computer users to navigate the metadata and formulate the queries without computer expert intervention. The Querytool leverages medical vocabularies such as ICD9, SNOMED-CT, LOINC, NDC and CPT4. Unfortunately, each vocabulary presents its own obstacles. For instance, ICD9 codes contain categories that can be used respectively for coding. On the other hand, NDC drug codes can be reused so that their meanings change from year to year. (Murphy et al).
The second challenge involved construction logic. “Patient inclusion and exclusion criteria for most research studies are jumbles of different types of information.” (Murphy et al). For instance, a researcher might request all patients who have been diagnosed with a certain disease and are in a particular age group but do not take a certain medication. Therefore, it was the Querytool’s objective to disguise the complex construction logic with an intuitive interface (Figure 5).
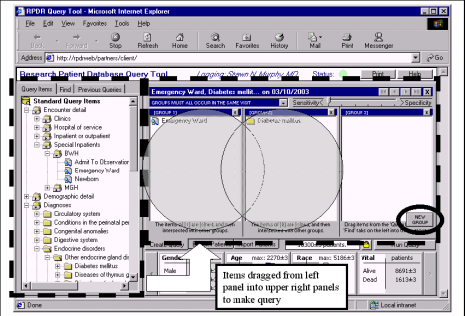
Figure 5 – RPDR Querytool used for selected cohorts from a tree structure into a Venn Diagram (Murphy et al, 2003)
In short, the Querytool is an excellent example of a data warehouse graphical user interface to novice database users for clinical research. The end user is easily able to narrow down the 1.8 million patients at Partners to a manageable number between 100-1000 patients. Finally, Murphy states “The Querytool has achieved excellent acceptance at Partners Healthcare Inc. and is the most prevalent way of obtaining research cohorts.”
4.2 Partners Healthcare i2b2
References
Inmon, W. H., Imhoff, C., Sousa, R. (2001). Introducing the Corporate Information Factory 2nd Edition
New York: John Wiley & Sons, Inc.
Lieberman, M., Ricciardi, T., Masarie, F., Spackman, K. (2003), The Use of SNOMED-CT Simplifies Querying of a Clinical Data Warehouse . AMIA Annu Symp Proc. 2003;
2003. 910. Retrieved November 16, 2006 from
http://www.pubmedcentral.nih.gov/articlerender.fcgi?artid=1480260
Murphy, S., Gainer, V., Chueh, H.C. (2003), A Visual Interface Designed for Novice Users to find Research Patient Cohorts in a Large Biomedical Database . AMIA Annu Symp Proc. 2003;
2003. 489–493. Retrieved November 15, 2006 from
http://www.pubmedcentral.nih.gov/articlerender.fcgi?tool=pmcentrez&artid=1480150
Adelman, Sid & Terpeluk-Moss, Larissa (2000). Data Warehouse Project Management . Boston: Addison Wesley.
Berry, M. J. A. & Linoff, G. (2000). Mastering Data Mining: The Art and Science of Customer Relationship Management . Hoboken: John Wiley & Sons.
Berson, A. & Smith, S. & Thearling, K. (2000). Building Data Mining Applications for CRM. New York: Computing McGraw-Hill.
Bray, T. (2001). What is RDF
Referenced July 26, 2003 from http://www.xml.com/pub/a/2001/01/24/rdf.html?page=2
Delmater, R. & Hancock, M. (2001). Data Mining Explained: A Manager's Guide to Customer-Centric Business Intelligence. St. Louis: Digital Press.
English, Larry P. (1999). Improving Data Warehouse and Business Information Quality. New York: Johm Wiley & Sons.
Han, Jiawei & Kamber, Micheline (2001). Data Mining: Concepts and Techniques. USA: San Francisco: Morgan Kaufmann.
Hobbs, Lilian; Hillson, Susan & Lawande, Shilpa (2003). Oracle9iR2 Data Warehousing. Burlington: Digital Press.
Hoffer, Jeffrey A.; Prescott, Mary B. & McFadden, Fred R. (2002). Modern Database Management. Upper Saddle River: Prentice Hall.
Inmon, W. H. (2001)(a). A Brief History of Metadata
Retrieved July 20, 2003 from http://www.inmoncif.com//library/whiteprs/wp.asp#Metadata
Inmon, W. H. (2001)(b). An Illustrated Taxonomy of Metadata
Retrieved July 20, 2003 from http://www.inmoncif.com//library/whiteprs/wp.asp#Metadata
Inmon, W. H. (2002). Building the Data Warehouse.
New York: John Wiley & Sons, Inc.
Inmon, W. H. (2000). Metadata in the Data Warehouse
Retrieved July 20, 2003 from http://www.inmoncif.com//library/whiteprs/wp.asp#Metadata
Inmon, W. H. (1997). Metadata in the Data Warehouse: A Statement of Vision
Retrieved July 20, 2003 from http://www.inmoncif.com//library/whiteprs/wp.asp#Metadata
Jarke, Matthias; Maurizio, Lenzerini; Vassiliou, Yannis & Vassiliadis, Panos (2003). Fundamentals of Data Warehouses. (2nd. Edition). Berlin: Springer.
Johnson, Diane (1999). Implementing a Hybrid Online Analytical Processing (HOLAP) solution. In Purba, Sanjiv (Ed.). Data Management Handbook. (3rd. edition, pp. 747-753). Boca Raton: Auerbach.
Meyer, Don, Cannon, Casey (1998). Building a Better Data Warehouse. Upper Saddle River: Prentice Hall.
Scalzo, Bert (2003). Oracle DBA Guide to Data Warehousing and Star Schemas.
Upper Saddle River: Prentice Hall PTR.