i2b2 Feature/s:
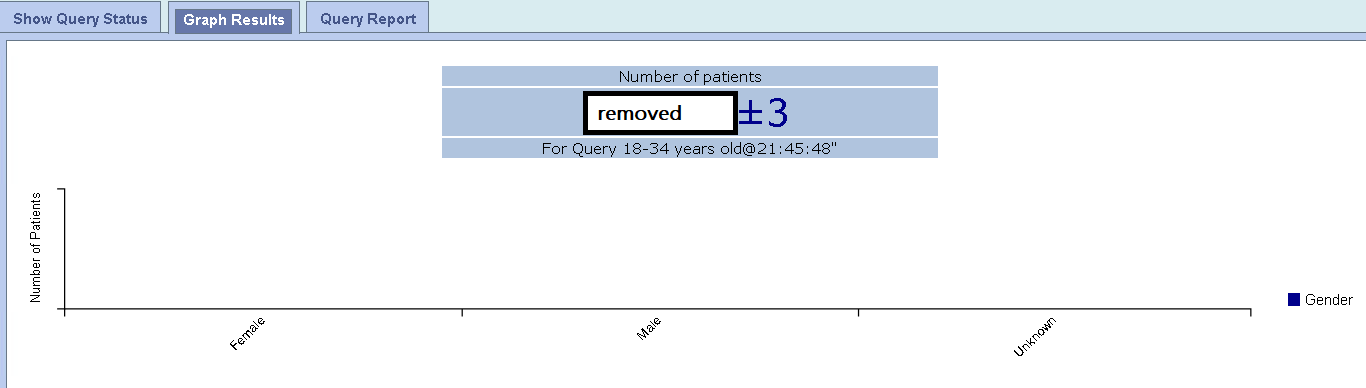
Analysis Breakdowns - Graphs
1. Select a Term such as Age.
No work has yet been logged on this issue.
{"report":{"fcp":1787,"ttfb":308.19999999925494,"pageVisibility":"visible","entityId":11667,"key":"jira.project.issue.view-issue","isInitial":true,"threshold":1000,"elementTimings":{},"userDeviceMemory":8,"userDeviceProcessors":16,"apdex":0.5,"journeyId":"e4bc2509-8e3a-4d43-a878-679dfbd513fb","navigationType":0,"readyForUser":1868,"redirectCount":0,"resourceLoadedEnd":2130.599999997765,"resourceLoadedStart":313.5999999977648,"resourceTiming":[{"duration":70.40000000223517,"initiatorType":"link","name":"https://community.i2b2.org/jira/s/7fd763ecdf5ed1f47fc4d22fa8382e97-CDN/4x9nqn/820011/16zrvj4/49fa3aa3d35a2cc689cbf274e66cc41a/_/download/contextbatch/css/_super/batch.css","startTime":313.5999999977648,"connectEnd":0,"connectStart":0,"domainLookupEnd":0,"domainLookupStart":0,"fetchStart":313.5999999977648,"redirectEnd":0,"redirectStart":0,"requestStart":0,"responseEnd":384,"responseStart":0,"secureConnectionStart":0},{"duration":70.10000000149012,"initiatorType":"link","name":"https://community.i2b2.org/jira/s/898b8076c5e82f53cd816ca393e45a56-CDN/4x9nqn/820011/16zrvj4/f614b50eeb842ebd1ea7ab2903699907/_/download/contextbatch/css/project.issue.navigator,jira.view.issue,jira.global,atl.general,-_super/batch.css?jira.create.linked.issue=true&richediton=true","startTime":313.8999999985099,"connectEnd":0,"connectStart":0,"domainLookupEnd":0,"domainLookupStart":0,"fetchStart":313.8999999985099,"redirectEnd":0,"redirectStart":0,"requestStart":0,"responseEnd":384,"responseStart":0,"secureConnectionStart":0},{"duration":1133,"initiatorType":"script","name":"https://community.i2b2.org/jira/s/4c9c503fe98f210445831b0d7b0cdc33-CDN/4x9nqn/820011/16zrvj4/49fa3aa3d35a2cc689cbf274e66cc41a/_/download/contextbatch/js/_super/batch.js?locale=en-US","startTime":313.8999999985099,"connectEnd":313.8999999985099,"connectStart":313.8999999985099,"domainLookupEnd":313.8999999985099,"domainLookupStart":313.8999999985099,"fetchStart":313.8999999985099,"redirectEnd":0,"redirectStart":0,"requestStart":313.8999999985099,"responseEnd":1446.8999999985099,"responseStart":1446.8999999985099,"secureConnectionStart":313.8999999985099},{"duration":1157.0999999977648,"initiatorType":"script","name":"https://community.i2b2.org/jira/s/694e598c1ae48b0f96655173631cd247-CDN/4x9nqn/820011/16zrvj4/f614b50eeb842ebd1ea7ab2903699907/_/download/contextbatch/js/project.issue.navigator,jira.view.issue,jira.global,atl.general,-_super/batch.js?jira.create.linked.issue=true&locale=en-US&richediton=true","startTime":314,"connectEnd":314,"connectStart":314,"domainLookupEnd":314,"domainLookupStart":314,"fetchStart":314,"redirectEnd":0,"redirectStart":0,"requestStart":314,"responseEnd":1471.0999999977648,"responseStart":1471.0999999977648,"secureConnectionStart":314},{"duration":1159.5,"initiatorType":"script","name":"https://community.i2b2.org/jira/s/53f54e0ac3f00bb56b136b4d2fff2853-CDN/4x9nqn/820011/16zrvj4/aae1242f5fc81cc6a5bb8bc963ccda29/_/download/contextbatch/js/atl.global,-_super/batch.js?locale=en-US","startTime":314.0999999977648,"connectEnd":314.0999999977648,"connectStart":314.0999999977648,"domainLookupEnd":314.0999999977648,"domainLookupStart":314.0999999977648,"fetchStart":314.0999999977648,"redirectEnd":0,"redirectStart":0,"requestStart":314.0999999977648,"responseEnd":1473.5999999977648,"responseStart":1473.5999999977648,"secureConnectionStart":314.0999999977648},{"duration":1160.300000000745,"initiatorType":"script","name":"https://community.i2b2.org/jira/s/d41d8cd98f00b204e9800998ecf8427e-CDN/4x9nqn/820011/16zrvj4/1.0/_/download/batch/jira.webresources:calendar-en/jira.webresources:calendar-en.js","startTime":314.19999999925494,"connectEnd":314.19999999925494,"connectStart":314.19999999925494,"domainLookupEnd":314.19999999925494,"domainLookupStart":314.19999999925494,"fetchStart":314.19999999925494,"redirectEnd":0,"redirectStart":0,"requestStart":314.19999999925494,"responseEnd":1474.5,"responseStart":1474.5,"secureConnectionStart":314.19999999925494},{"duration":1160.699999999255,"initiatorType":"script","name":"https://community.i2b2.org/jira/s/d41d8cd98f00b204e9800998ecf8427e-CDN/4x9nqn/820011/16zrvj4/1.0/_/download/batch/jira.webresources:calendar-localisation-moment/jira.webresources:calendar-localisation-moment.js","startTime":314.30000000074506,"connectEnd":314.30000000074506,"connectStart":314.30000000074506,"domainLookupEnd":314.30000000074506,"domainLookupStart":314.30000000074506,"fetchStart":314.30000000074506,"redirectEnd":0,"redirectStart":0,"requestStart":314.30000000074506,"responseEnd":1475,"responseStart":1475,"secureConnectionStart":314.30000000074506},{"duration":1166.699999999255,"initiatorType":"link","name":"https://community.i2b2.org/jira/s/30748292e4ca68be6947d7969829384b-CDN/4x9nqn/820011/16zrvj4/4f66da484ef7d95a2a604d3ab014374c/_/download/contextbatch/css/jira.global.look-and-feel,-_super/batch.css","startTime":314.3999999985099,"connectEnd":0,"connectStart":0,"domainLookupEnd":0,"domainLookupStart":0,"fetchStart":314.3999999985099,"redirectEnd":0,"redirectStart":0,"requestStart":0,"responseEnd":1481.0999999977648,"responseStart":0,"secureConnectionStart":0},{"duration":1161.6000000014901,"initiatorType":"script","name":"https://community.i2b2.org/jira/rest/api/1.0/shortcuts/820011/766848d8ff8ea3676a80e44dfb51696a/shortcuts.js?context=issuenavigation&context=issueaction","startTime":314.5999999977648,"connectEnd":314.5999999977648,"connectStart":314.5999999977648,"domainLookupEnd":314.5999999977648,"domainLookupStart":314.5999999977648,"fetchStart":314.5999999977648,"redirectEnd":0,"redirectStart":0,"requestStart":314.5999999977648,"responseEnd":1476.199999999255,"responseStart":1476.199999999255,"secureConnectionStart":314.5999999977648},{"duration":1143.3999999985099,"initiatorType":"link","name":"https://community.i2b2.org/jira/s/3ac36323ba5e4eb0af2aa7ac7211b4bb-CDN/4x9nqn/820011/16zrvj4/efa42a25652b26dfd802540c024826b3/_/download/contextbatch/css/com.atlassian.jira.projects.sidebar.init,-_super,-jira.view.issue,-project.issue.navigator/batch.css?jira.create.linked.issue=true&richediton=true","startTime":340.69999999925494,"connectEnd":0,"connectStart":0,"domainLookupEnd":0,"domainLookupStart":0,"fetchStart":340.69999999925494,"redirectEnd":0,"redirectStart":0,"requestStart":0,"responseEnd":1484.0999999977648,"responseStart":0,"secureConnectionStart":0},{"duration":1146.0999999977648,"initiatorType":"script","name":"https://community.i2b2.org/jira/s/8087506fefd02b4096991c90836b49f6-CDN/4x9nqn/820011/16zrvj4/efa42a25652b26dfd802540c024826b3/_/download/contextbatch/js/com.atlassian.jira.projects.sidebar.init,-_super,-jira.view.issue,-project.issue.navigator/batch.js?jira.create.linked.issue=true&locale=en-US&richediton=true","startTime":340.80000000074506,"connectEnd":340.80000000074506,"connectStart":340.80000000074506,"domainLookupEnd":340.80000000074506,"domainLookupStart":340.80000000074506,"fetchStart":340.80000000074506,"redirectEnd":0,"redirectStart":0,"requestStart":340.80000000074506,"responseEnd":1486.8999999985099,"responseStart":1486.8999999985099,"secureConnectionStart":340.80000000074506},{"duration":1782.1000000014901,"initiatorType":"script","name":"https://community.i2b2.org/jira/s/d41d8cd98f00b204e9800998ecf8427e-CDN/4x9nqn/820011/16zrvj4/1.0/_/download/batch/jira.webresources:bigpipe-js/jira.webresources:bigpipe-js.js","startTime":348.0999999977648,"connectEnd":348.0999999977648,"connectStart":348.0999999977648,"domainLookupEnd":348.0999999977648,"domainLookupStart":348.0999999977648,"fetchStart":348.0999999977648,"redirectEnd":0,"redirectStart":0,"requestStart":348.0999999977648,"responseEnd":2130.199999999255,"responseStart":2130.199999999255,"secureConnectionStart":348.0999999977648},{"duration":1778,"initiatorType":"script","name":"https://community.i2b2.org/jira/s/d41d8cd98f00b204e9800998ecf8427e-CDN/4x9nqn/820011/16zrvj4/1.0/_/download/batch/jira.webresources:bigpipe-init/jira.webresources:bigpipe-init.js","startTime":352.5999999977648,"connectEnd":352.5999999977648,"connectStart":352.5999999977648,"domainLookupEnd":352.5999999977648,"domainLookupStart":352.5999999977648,"fetchStart":352.5999999977648,"redirectEnd":0,"redirectStart":0,"requestStart":352.5999999977648,"responseEnd":2130.599999997765,"responseStart":2130.599999997765,"secureConnectionStart":352.5999999977648},{"duration":430.30000000074506,"initiatorType":"xmlhttprequest","name":"https://community.i2b2.org/jira/rest/webResources/1.0/resources","startTime":1699.5999999977648,"connectEnd":1699.5999999977648,"connectStart":1699.5999999977648,"domainLookupEnd":1699.5999999977648,"domainLookupStart":1699.5999999977648,"fetchStart":1699.5999999977648,"redirectEnd":0,"redirectStart":0,"requestStart":1699.5999999977648,"responseEnd":2129.89999999851,"responseStart":2129.89999999851,"secureConnectionStart":1699.5999999977648}],"fetchStart":1,"domainLookupStart":1,"domainLookupEnd":1,"connectStart":1,"connectEnd":1,"requestStart":280,"responseStart":309,"responseEnd":353,"domLoading":313,"domInteractive":2218,"domContentLoadedEventStart":2218,"domContentLoadedEventEnd":2253,"domComplete":2515,"loadEventStart":2515,"loadEventEnd":2515,"userAgent":"Mozilla/5.0 AppleWebKit/537.36 (KHTML, like Gecko; compatible; ClaudeBot/1.0; +claudebot@anthropic.com)","marks":[{"name":"bigPipe.sidebar-id.start","time":2199.300000000745},{"name":"bigPipe.sidebar-id.end","time":2200.099999997765},{"name":"bigPipe.activity-panel-pipe-id.start","time":2200.199999999255},{"name":"bigPipe.activity-panel-pipe-id.end","time":2200.599999997765},{"name":"activityTabFullyLoaded","time":2257.800000000745}],"measures":[],"correlationId":"5cb845e7568378","effectiveType":"4g","downlink":9.1,"rtt":0,"serverDuration":57,"dbReadsTimeInMs":6,"dbConnsTimeInMs":9,"applicationHash":"0629dd8d260e3954ece49053e565d01dabe11609","experiments":[]}}
Bug
 Major
Major