Details
-
Bug
-
Status: New
-
 Major
Major
-
Resolution: Unresolved
-
1.7.12
-
None
-
None
-
Windows Server 2016
-
Graph Results
-
Analysis Breakdowns - Graphs
-
SQL Server
-
Chrome
Description
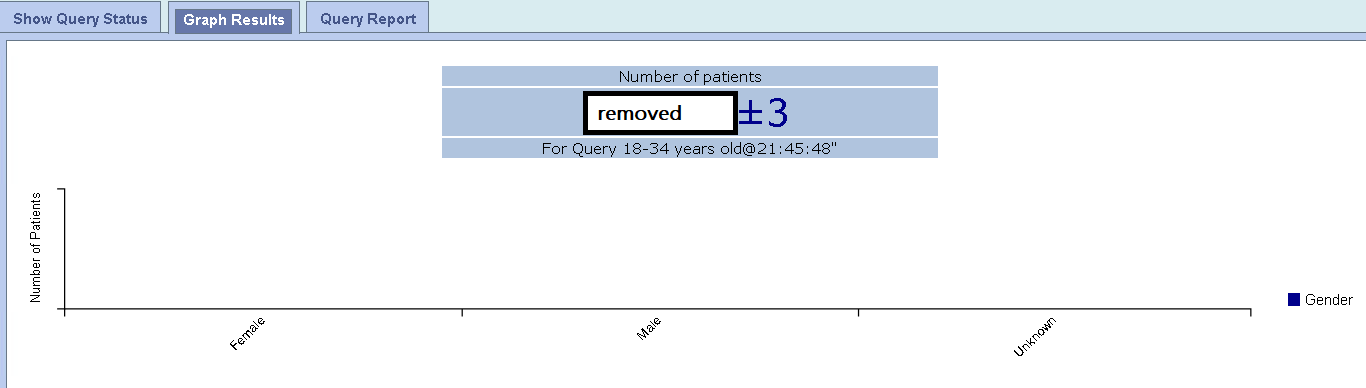
1. Select a Term such as Age.
2. Run Query with "Number of patients" and "Gender patient breakdown".
3. Under Query Results graph X/Y axis are shown, but not bars
4. Note: Under Show Query Status the correct numeric values for the breakdown are listed (but no bars on the graphs)
2. Run Query with "Number of patients" and "Gender patient breakdown".
3. Under Query Results graph X/Y axis are shown, but not bars
4. Note: Under Show Query Status the correct numeric values for the breakdown are listed (but no bars on the graphs)