i2b2 Feature/s:
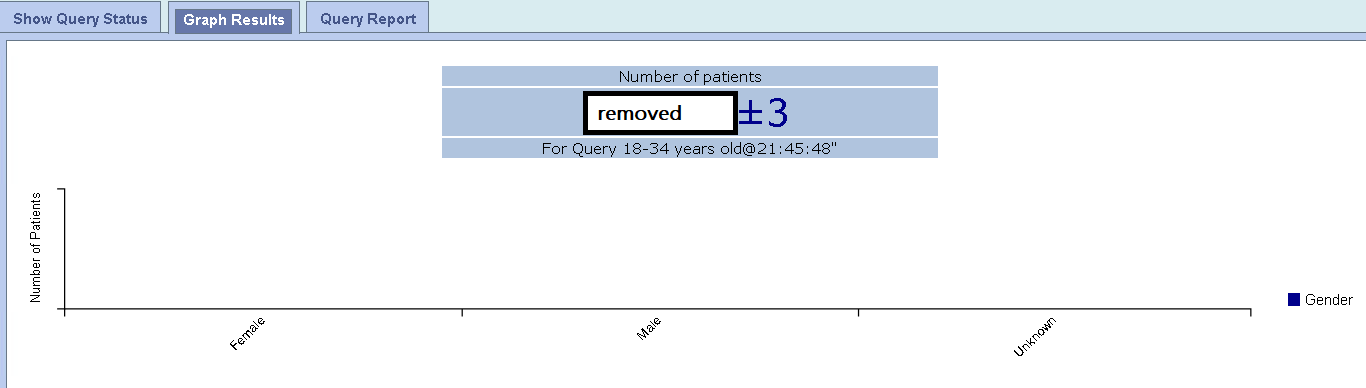
Analysis Breakdowns - Graphs
1. Select a Term such as Age.
{"report":{"fcp":1077.6000000000931,"ttfb":332.6999999997206,"pageVisibility":"visible","entityId":11667,"key":"jira.project.issue.view-issue","isInitial":true,"threshold":1000,"elementTimings":{},"userDeviceMemory":8,"userDeviceProcessors":16,"apdex":0.5,"journeyId":"06e03074-d9cc-41a8-b336-a28739734f91","navigationType":0,"readyForUser":1252.5,"redirectCount":0,"resourceLoadedEnd":1268,"resourceLoadedStart":415.39999999990687,"resourceTiming":[{"duration":67.89999999990687,"initiatorType":"link","name":"https://community.i2b2.org/jira/s/7fd763ecdf5ed1f47fc4d22fa8382e97-CDN/4x9nqn/820011/16zrvj4/49fa3aa3d35a2cc689cbf274e66cc41a/_/download/contextbatch/css/_super/batch.css","startTime":415.39999999990687,"connectEnd":0,"connectStart":0,"domainLookupEnd":0,"domainLookupStart":0,"fetchStart":415.39999999990687,"redirectEnd":0,"redirectStart":0,"requestStart":0,"responseEnd":483.29999999981374,"responseStart":0,"secureConnectionStart":0},{"duration":70.20000000018626,"initiatorType":"link","name":"https://community.i2b2.org/jira/s/898b8076c5e82f53cd816ca393e45a56-CDN/4x9nqn/820011/16zrvj4/f614b50eeb842ebd1ea7ab2903699907/_/download/contextbatch/css/project.issue.navigator,jira.view.issue,jira.global,atl.general,-_super/batch.css?jira.create.linked.issue=true&richediton=true","startTime":415.6999999997206,"connectEnd":0,"connectStart":0,"domainLookupEnd":0,"domainLookupStart":0,"fetchStart":415.6999999997206,"redirectEnd":0,"redirectStart":0,"requestStart":0,"responseEnd":485.89999999990687,"responseStart":0,"secureConnectionStart":0},{"duration":224.8000000002794,"initiatorType":"script","name":"https://community.i2b2.org/jira/s/4c9c503fe98f210445831b0d7b0cdc33-CDN/4x9nqn/820011/16zrvj4/49fa3aa3d35a2cc689cbf274e66cc41a/_/download/contextbatch/js/_super/batch.js?locale=en-US","startTime":415.79999999981374,"connectEnd":518.2999999998137,"connectStart":491.10000000009313,"domainLookupEnd":415.79999999981374,"domainLookupStart":415.79999999981374,"fetchStart":415.79999999981374,"redirectEnd":0,"redirectStart":0,"requestStart":518.2999999998137,"responseEnd":640.6000000000931,"responseStart":538,"secureConnectionStart":504.89999999990687},{"duration":128.8000000002794,"initiatorType":"script","name":"https://community.i2b2.org/jira/s/53f54e0ac3f00bb56b136b4d2fff2853-CDN/4x9nqn/820011/16zrvj4/aae1242f5fc81cc6a5bb8bc963ccda29/_/download/contextbatch/js/atl.global,-_super/batch.js?locale=en-US","startTime":416.29999999981374,"connectEnd":526.6999999997206,"connectStart":494.89999999990687,"domainLookupEnd":416.29999999981374,"domainLookupStart":416.29999999981374,"fetchStart":416.29999999981374,"redirectEnd":0,"redirectStart":0,"requestStart":526.7999999998137,"responseEnd":545.1000000000931,"responseStart":543.1000000000931,"secureConnectionStart":511.89999999990687},{"duration":241.10000000009313,"initiatorType":"script","name":"https://community.i2b2.org/jira/s/694e598c1ae48b0f96655173631cd247-CDN/4x9nqn/820011/16zrvj4/f614b50eeb842ebd1ea7ab2903699907/_/download/contextbatch/js/project.issue.navigator,jira.view.issue,jira.global,atl.general,-_super/batch.js?jira.create.linked.issue=true&locale=en-US&richediton=true","startTime":416.29999999981374,"connectEnd":523.1000000000931,"connectStart":492.1999999997206,"domainLookupEnd":416.29999999981374,"domainLookupStart":416.29999999981374,"fetchStart":416.29999999981374,"redirectEnd":0,"redirectStart":0,"requestStart":523.1000000000931,"responseEnd":657.3999999999069,"responseStart":546.2999999998137,"secureConnectionStart":507.89999999990687},{"duration":188.89999999990687,"initiatorType":"script","name":"https://community.i2b2.org/jira/s/d41d8cd98f00b204e9800998ecf8427e-CDN/4x9nqn/820011/16zrvj4/1.0/_/download/batch/jira.webresources:calendar-en/jira.webresources:calendar-en.js","startTime":416.39999999990687,"connectEnd":584,"connectStart":545,"domainLookupEnd":416.39999999990687,"domainLookupStart":416.39999999990687,"fetchStart":416.39999999990687,"redirectEnd":0,"redirectStart":0,"requestStart":586.5,"responseEnd":605.2999999998137,"responseStart":601.2999999998137,"secureConnectionStart":565.7999999998137},{"duration":258.79999999981374,"initiatorType":"script","name":"https://community.i2b2.org/jira/s/d41d8cd98f00b204e9800998ecf8427e-CDN/4x9nqn/820011/16zrvj4/1.0/_/download/batch/jira.webresources:calendar-localisation-moment/jira.webresources:calendar-localisation-moment.js","startTime":416.60000000009313,"connectEnd":635.6999999997206,"connectStart":605.1000000000931,"domainLookupEnd":416.60000000009313,"domainLookupStart":416.60000000009313,"fetchStart":416.60000000009313,"redirectEnd":0,"redirectStart":0,"requestStart":652.6000000000931,"responseEnd":675.3999999999069,"responseStart":670.3999999999069,"secureConnectionStart":622.1999999997206},{"duration":81.3000000002794,"initiatorType":"link","name":"https://community.i2b2.org/jira/s/30748292e4ca68be6947d7969829384b-CDN/4x9nqn/820011/16zrvj4/4f66da484ef7d95a2a604d3ab014374c/_/download/contextbatch/css/jira.global.look-and-feel,-_super/batch.css","startTime":416.6999999997206,"connectEnd":0,"connectStart":0,"domainLookupEnd":0,"domainLookupStart":0,"fetchStart":416.6999999997206,"redirectEnd":0,"redirectStart":0,"requestStart":0,"responseEnd":498,"responseStart":0,"secureConnectionStart":0},{"duration":293.89999999990687,"initiatorType":"script","name":"https://community.i2b2.org/jira/rest/api/1.0/shortcuts/820011/766848d8ff8ea3676a80e44dfb51696a/shortcuts.js?context=issuenavigation&context=issueaction","startTime":416.79999999981374,"connectEnd":689.6000000000931,"connectStart":640.5,"domainLookupEnd":416.79999999981374,"domainLookupStart":416.79999999981374,"fetchStart":416.79999999981374,"redirectEnd":0,"redirectStart":0,"requestStart":691.5,"responseEnd":710.6999999997206,"responseStart":709.1000000000931,"secureConnectionStart":667.6000000000931},{"duration":158.89999999990687,"initiatorType":"link","name":"https://community.i2b2.org/jira/s/3ac36323ba5e4eb0af2aa7ac7211b4bb-CDN/4x9nqn/820011/16zrvj4/efa42a25652b26dfd802540c024826b3/_/download/contextbatch/css/com.atlassian.jira.projects.sidebar.init,-_super,-jira.view.issue,-project.issue.navigator/batch.css?jira.create.linked.issue=true&richediton=true","startTime":449.10000000009313,"connectEnd":0,"connectStart":0,"domainLookupEnd":0,"domainLookupStart":0,"fetchStart":449.10000000009313,"redirectEnd":0,"redirectStart":0,"requestStart":0,"responseEnd":608,"responseStart":0,"secureConnectionStart":0},{"duration":259.3000000002794,"initiatorType":"script","name":"https://community.i2b2.org/jira/s/8087506fefd02b4096991c90836b49f6-CDN/4x9nqn/820011/16zrvj4/efa42a25652b26dfd802540c024826b3/_/download/contextbatch/js/com.atlassian.jira.projects.sidebar.init,-_super,-jira.view.issue,-project.issue.navigator/batch.js?jira.create.linked.issue=true&locale=en-US&richediton=true","startTime":449.29999999981374,"connectEnd":689.6999999997206,"connectStart":652,"domainLookupEnd":449.29999999981374,"domainLookupStart":449.29999999981374,"fetchStart":449.29999999981374,"redirectEnd":0,"redirectStart":0,"requestStart":691.7999999998137,"responseEnd":708.6000000000931,"responseStart":707.3999999999069,"secureConnectionStart":674},{"duration":805.7999999998137,"initiatorType":"script","name":"https://community.i2b2.org/jira/s/d41d8cd98f00b204e9800998ecf8427e-CDN/4x9nqn/820011/16zrvj4/1.0/_/download/batch/jira.webresources:bigpipe-js/jira.webresources:bigpipe-js.js","startTime":458,"connectEnd":1248.1000000000931,"connectStart":1221.1999999997206,"domainLookupEnd":458,"domainLookupStart":458,"fetchStart":458,"redirectEnd":0,"redirectStart":0,"requestStart":1248.1999999997206,"responseEnd":1263.7999999998137,"responseStart":1262.8999999999069,"secureConnectionStart":1234.7999999998137},{"duration":804.3000000002794,"initiatorType":"script","name":"https://community.i2b2.org/jira/s/d41d8cd98f00b204e9800998ecf8427e-CDN/4x9nqn/820011/16zrvj4/1.0/_/download/batch/jira.webresources:bigpipe-init/jira.webresources:bigpipe-init.js","startTime":463.6999999997206,"connectEnd":1251.3999999999069,"connectStart":1221.1000000000931,"domainLookupEnd":463.6999999997206,"domainLookupStart":463.6999999997206,"fetchStart":463.6999999997206,"redirectEnd":0,"redirectStart":0,"requestStart":1251.3999999999069,"responseEnd":1268,"responseStart":1267,"secureConnectionStart":1236.1999999997206},{"duration":388,"initiatorType":"xmlhttprequest","name":"https://community.i2b2.org/jira/rest/webResources/1.0/resources","startTime":937.8999999999069,"connectEnd":1305.2999999998137,"connectStart":1278.1999999997206,"domainLookupEnd":937.8999999999069,"domainLookupStart":937.8999999999069,"fetchStart":937.8999999999069,"redirectEnd":0,"redirectStart":0,"requestStart":1305.5,"responseEnd":1325.8999999999069,"responseStart":1325.1999999997206,"secureConnectionStart":1292.1000000000931}],"fetchStart":0,"domainLookupStart":0,"domainLookupEnd":0,"connectStart":87,"connectEnd":304,"secureConnectionStart":275,"requestStart":304,"responseStart":333,"responseEnd":463,"domLoading":337,"domInteractive":1378,"domContentLoadedEventStart":1378,"domContentLoadedEventEnd":1453,"domComplete":1719,"loadEventStart":1719,"loadEventEnd":1720,"userAgent":"Mozilla/5.0 AppleWebKit/537.36 (KHTML, like Gecko; compatible; ClaudeBot/1.0; +claudebot@anthropic.com)","marks":[{"name":"bigPipe.sidebar-id.start","time":1339.6999999997206},{"name":"bigPipe.sidebar-id.end","time":1340.5},{"name":"bigPipe.activity-panel-pipe-id.start","time":1340.7999999998137},{"name":"bigPipe.activity-panel-pipe-id.end","time":1341.7999999998137},{"name":"activityTabFullyLoaded","time":1476.8999999999069}],"measures":[],"correlationId":"8fc9abc52f98ad","effectiveType":"4g","downlink":9.2,"rtt":0,"serverDuration":145,"dbReadsTimeInMs":8,"dbConnsTimeInMs":12,"applicationHash":"0629dd8d260e3954ece49053e565d01dabe11609","experiments":[]}}
Bug
 Major
Major
Roles are listed in the i2b2pm table [PM_PROJECT_USER_ROLES], and are best modified via the Administration interface.
Either add additional roles to the config file, or add roles to individual users.
Based on these facts this issue is now resolved and can be closed. Thanks