Page History
...
- Navigate to the "Specify Data" tab. Drag and drop a Patient Set and a concept (ontology term) onto the appropriate input boxes:#* Enter appropriate values in the 'Starting Patient' and 'Number of Patients' fields that are then presented, to specify the subset of the patient set to use. Also specify at the 'Query Subgroup Size'field the size of smaller queries of subgroups of patients to be used iteratively, to facilitate reducing the risks of overwhelming the server (i2b2 hive).#* Click on the corresponding 'HELP' hotlinks next to the 'Starting Patient' and 'Number of Patients'fields, and the 'HELP' hotlink next to the 'Query Subgroup Size' field, for detailed information; and enter corresponding appropriate values.
- Click on the corresponding 'HINT' hotlink below the 'Concepts' field for hint or suggestion for selecting concepts.
- Next, select the appropriate grouping of observation tallies against which to generate the resulting histograms at the "Output Options" tab
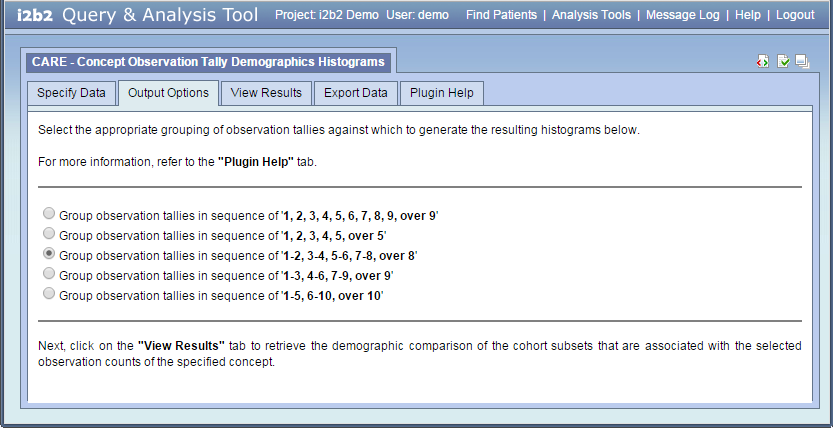
- Finally, select the "View Results" tab to wait for and view the generated demographic histograms.
...
1.0 | Initial release, with options of using a subset of a large patient set; selection of observation tallies grouping for resulting histograms; user-friendly feedback (estimated run-time, etc.), helps & hints. | 2015 Q1 |
Terms of Use
This plugin is published under the GNU GPL v3 license.
...